
I have been building Power BI reports for about ten years. Semantic models, DAX that had to be right to the penny, report pages argued over in workshops, the lot. I still build them, and for a lot of problems they are still the correct answer.
Lately, though, I keep reaching for something else first. When a small or mid-sized company comes to me with an operational problem, I increasingly build them a web app instead of a report. Not because Power BI got worse. Because building a web application got dramatically cheaper, and the things a report page cannot do turned out to be exactly the things those companies needed.
This is what changed, what it looks like in practice, and how I decide which one to build.
What is a small data app?
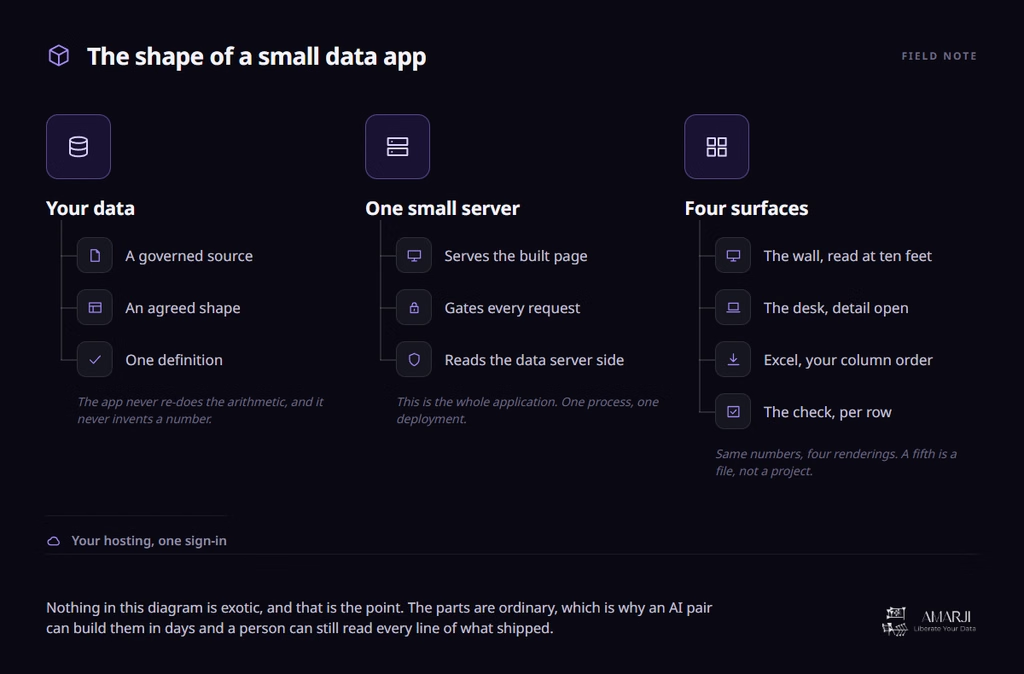
A small data app is a web application that reads your governed numbers and presents them for one specific operational job. It sits in front of the data you already trust, adds a sign-in, and renders whatever the job needs: a wall display, a desk view, an export, a data entry form. It is usually a few thousand lines of code and it is deployed as one process.
That is the whole definition. There is no platform to buy and no per-seat licence to count. The interesting part is not the technology, it is what stops being a constraint once you are on a blank page instead of a report canvas.
The job that convinced me
A waste operator came to us with a problem that sounds trivial and is not. They have storage bays across several sites. Each bay holds a material, each material has a capacity, and the operation needs to know, right now and from across a room, which bays are filling up and which are about to cause a problem.
They had the data. What they did not have was a way for a depot supervisor to walk past a screen and know the answer in two seconds. That is a real constraint, and it is a physical one: the screen is a television on a wall, ten feet away, and the person looking at it is carrying something.
A report page can be put on a television. Making one legible from ten feet, with the right information density, that updates on its own and never shows a login prompt at 6am, is a fight. On a web page it is a layout decision you make once.
We built the board. Then, because the page was ours, the same afternoon requests kept landing and kept being cheap:
- A verification page where the client can check our figures per bay, group and sort them, and export the result. They use it to argue with us, which is the point.
- An Excel export with their column order and their number formats, not the export a tool decided to give us.
- A dialog for entering a reading by hand when the automated one is late, appended to a store that never overwrites history, with a badge showing which readings came from the app.
- A fourteen day forward strip showing allocated vehicle movements per site.
None of those were in the original brief. All of them shipped inside a fortnight of being asked for. That responsiveness is the actual product.
How fast is fast, honestly?
This is where most of the writing on AI-assisted development stops being useful, so let me be precise about it.
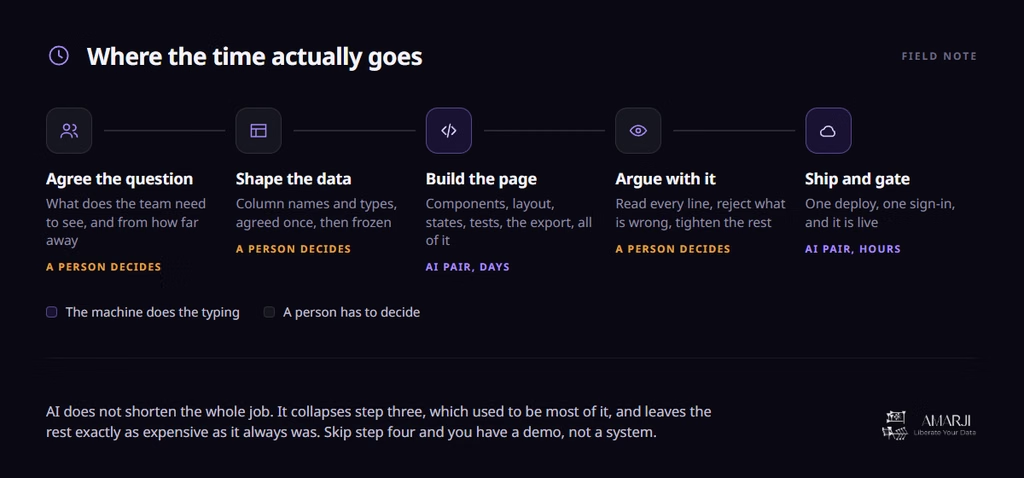
AI does not make the whole job faster. It collapses one step of it. Writing the components, the layout, the states, the tests, the export logic: that used to be most of the elapsed time, and now it is days rather than weeks. Everything either side of it costs exactly what it always did.
Agreeing what the depot actually needs to see still takes a conversation with someone who runs a depot. Fixing the shape of the data still takes a careful hour, and getting it wrong still poisons everything downstream. And reading what the machine wrote, rejecting the parts that are wrong and tightening the rest, is now the single most valuable thing a senior person does on the project.
Skip that last step and you have a demo, not a system. I have seen both, and the difference shows up about six weeks in, when someone asks for a change.
The honest headline is this: a working, deployed, gated internal application for a specific operational job is now a one to three week piece of work rather than a one to three month one. For a company with no data team, that moves the whole thing from “we should do that one day” to “do it this month”.
What stopped being a constraint
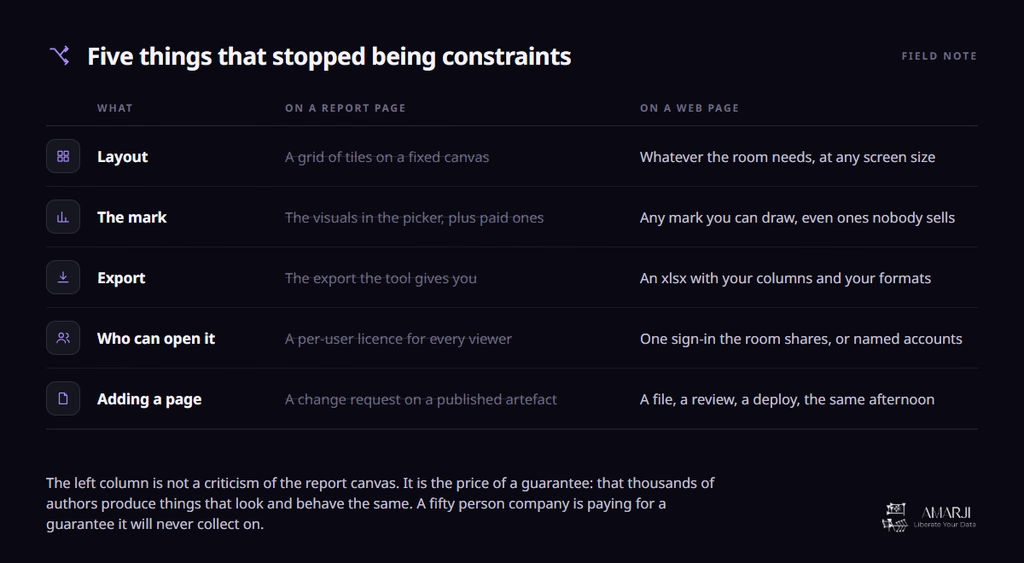
I want to be fair to the report canvas here, because I have made a living on it. The constraints in that table are the price of a guarantee: that thousands of authors across an enterprise produce things that look and behave consistently, publish through one governed pipeline, and can be picked up by anyone who knows the tool. That guarantee is worth a lot at scale.
A fifty person company is not getting much value from it. They have one or two people who build things, one operational problem that matters this quarter, and a screen in a depot that needs to be readable. They are paying for a guarantee they will never collect on.
The two that matter most in practice:
The layout is yours. Not a grid of tiles on a fixed canvas. A wall board at 1080p with type sized for ten feet, a desk view with the detail open, a print view, a phone view, whatever the job is. Same data, same definitions, different rendering.
The export is yours. Every operations team I have worked with lives in Excel, and every one of them has a preferred column order, a preferred number format and a set of columns they always delete. You can put all of that in the export because you wrote the export. One click, and the file arrives the way they were going to rearrange it anyway.
Is a custom web app secure?
This is the first question every IT manager asks, and they are right to ask it. A web app you built yourself has no vendor security posture to point at. So you have to be able to describe yours in one paragraph, and it has to be true.
Here is the shape we use, and it is deliberately boring. Every request passes an authentication gate. No credential ever reaches the browser, because the data is read server side. The process refuses to start if any configuration is missing. The dependency surface is kept near zero. And the secrets live in the hosting platform rather than in the code.
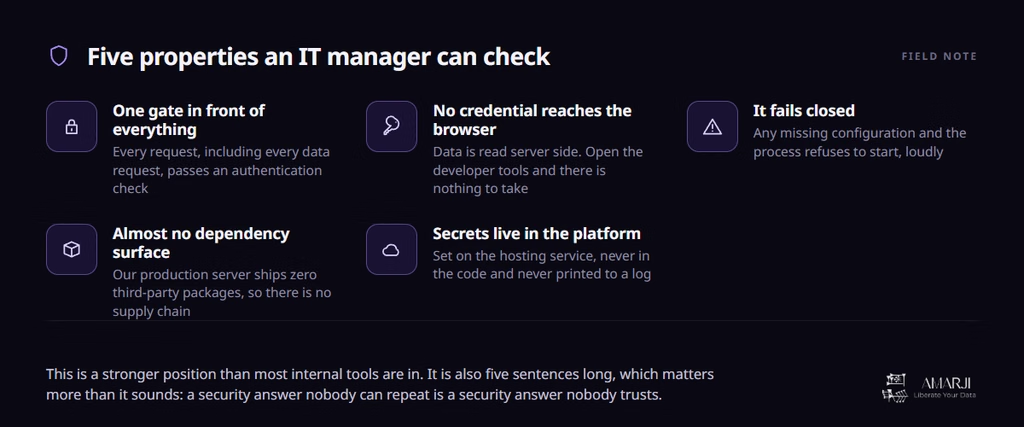
The gate is a signed cookie with a long lifetime, so a wall display signs in once and stays signed in while a browser on a desk behaves normally. Failing closed means an application that is plainly down, which is safer than one quietly serving an unprotected page and much safer than one quietly serving nothing while looking fine. And the secrets never get printed, not even into an error message, because log streams are readable by more people than you think.
That is five sentences an IT manager can check. It is a stronger position than most internal tools are in, and every part of it is something you can demonstrate rather than assert.
Who is this right for, and who is it wrong for?
It is right for you if you are between roughly twenty and five hundred people, you have one operational problem that a screen would fix, your numbers already exist somewhere trustworthy, and you have been told the reporting change you want is “not really how the tool works”. It is wrong for you if you need many self-service authors, if you need governed publishing across departments, or if nobody on your side will own it.
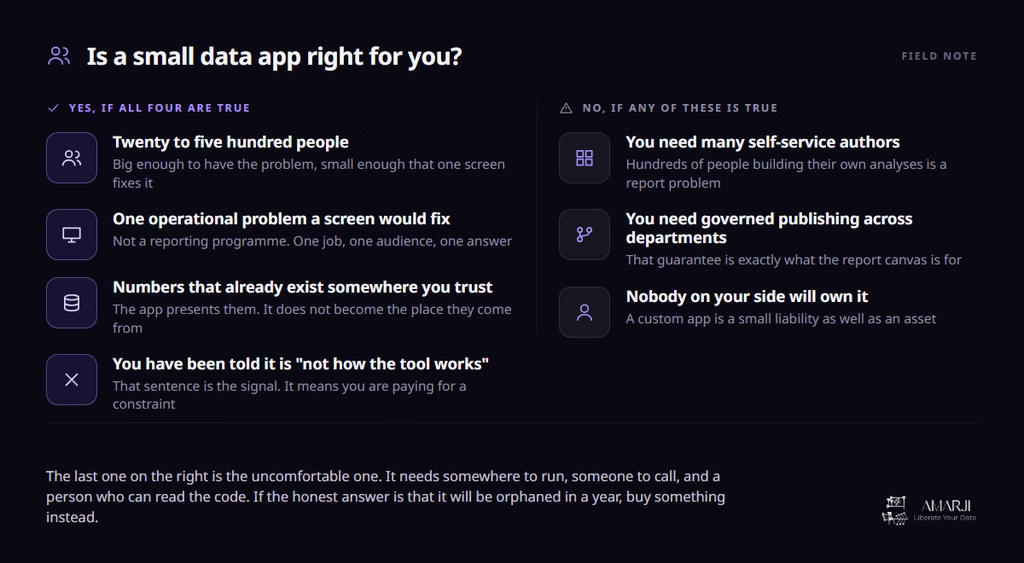
The four on the left have to be true together. Any one of them missing and you are building something more expensive than the problem. The right-hand column is not a consolation prize either: those are report problems, and the report canvas is genuinely excellent at them.
The last one on the right is the uncomfortable one, and it is the one people skip. A custom application is a small liability as well as an asset. It needs somewhere to run, someone to call, and a person who can read the code. If the honest answer is that it will be orphaned in a year, buy something instead.
What this actually costs you
Three things, and they are all real.
You give up the author community. Nobody else in your industry knows your app the way they know a report canvas, so onboarding a new analyst is a conversation rather than an assumption.
You give up the visual grammar people already recognise. That cuts both ways, because most of the value here comes from breaking it, but it is a genuine cost on day one.
And you take on ownership. Somebody has to hold the deployment, the sign-in and the small pile of code. In practice this is a retainer question rather than a hiring question at this size, but it does not go away by ignoring it.
The short version
Ten years in, my rule is roughly this. If the problem is “our people need to explore the numbers”, build the report. If the problem is “our operation needs this specific thing on this specific screen, and the tool keeps saying no”, build the app. The second used to be too expensive to justify at small scale. It is not any more.
The interesting thing is not that AI writes the code. It is that the economics of a small, sharp, purpose-built tool changed, and a whole class of company that was previously told to compromise does not have to.
Frequently asked
Do we need a Power BI licence for a custom web app? Not for the application itself. A web app you host is not a Power BI artefact and has no per-viewer licence attached to it. If it reads from a Power BI semantic model, the licensing rules for that model still apply and need checking against your tenant. If it reads from somewhere else, they do not apply at all.
How long does a small data app take to build? For a single, well-defined operational job with data that already exists: one to three weeks from agreement to deployment. The variable is almost never the code. It is how long it takes to agree what the screen should say and to fix the shape of the data behind it.
Can it export to Excel? Yes, and this is one of the better reasons to build one. Because you write the export, you control the columns, the order, the number formats and the sheet structure. Users get the file they were going to make by hand anyway.
Can we share it with people outside the company? Yes, though it changes the security design. Internal sharing behind a single sign-in is straightforward. External sharing means named accounts, per-user permissions and a harder look at what each viewer is allowed to see. Decide which one you need before the build starts, because retrofitting it is expensive.
Is this cheaper than Power BI? Sometimes, and it is the wrong question. The costs sit in different places: no per-seat licence, but you own hosting and maintenance. Choose on whether you need the thing the report canvas cannot do. If you do not, the report is the cheaper answer in every sense.